October 1 2026 | Deals | Industrial | Ai Infrastructure | Utilities & Infrastructure
A year-on-year snapshot
Ansarada’s Deal Indicators shows ANZ deal activity in August 2026 was 11.4% lower than in August 2025. A year earlier, the picture was relatively stable: August 2025 activity was 1.1% below August 2024.
Look beneath the headline, however, and the decline is not evenly shared across sectors.
| Sector | August 2026 vs August 2025 |
|---|---|
| Financials | +40% |
| Utilities | +33.3% |
| Real Estate | +19.5% |
| Materials | +28.6% |
| Consumer Discretionary | No change |
| Communication Services | No change |
| Information Technology | -5.9% |
| Industrials | -50% |
| Health Care | -47.6% |
| Energy | -71.4% |
| Consumer Staples | -83.3% |
Note: Smaller sectors have low monthly volumes, which can magnify percentage movements.
Financials and real estate, two of the larger sectors represented in the data, are both ahead of a year ago. Industrials and health care, meanwhile, have recorded declines of around 50%.
The market context behind the numbers
Ansarada’s Deal Indicators shows where activity is changing; it does not establish why those changes are occurring. However, several developments in the broader ANZ market provide useful context for the patterns appearing in the data.
The cost of capital has shifted. In August 2025, the RBA cash rate sat at 3.6% following three cuts that year. The RBA has since reversed course: on 29 September 2026 it lifted the cash rate by 25 basis points to 4.60% , its fourth increase of 2026 and the highest cash rate since November 2011.
The RBA said inflation remains elevated , pointing to factors including the broadening conflict in the Middle East and global energy prices running above its earlier assumptions. New Zealand has also moved rates higher, with the RBNZ lifting its official cash rate to 2.75% in September 2026.
Higher financing costs can change transaction economics and may increase the emphasis buyers and lenders place on earnings visibility, downside risk and financing structures.
Costs have become harder to forecast. The escalation of conflict in the Middle East has pushed fuel prices higher , adding another source of uncertainty for businesses exposed to fuel, freight, energy and materials costs.
Pressure is also visible in corporate insolvency data. Around 9,300 companies entered external administration in the year to February 2026, 76% above the previous five-year average, while construction accounts for 27% of corporate insolvencies.
These conditions do not necessarily explain the fall in industrials activity recorded by Deal Indicators, but they provide relevant context for the operating environment surrounding transactions in cost-sensitive sectors.
The regulatory environment has changed. Australia's mandatory merger regime took effect on 1 January 2026. Acquisitions meeting prescribed thresholds must now be notified to the ACCC and cannot proceed without approval or a notification waiver.
The implications will differ by transaction, but the new framework introduces additional regulatory considerations into transaction planning for deals within its scope.
Health care has its own dynamics. Following Healthscope's collapse, some sponsors have reportedly been contributing 50–55% equity to aged care and hospital deals, compared with 35–40% in 2021 and 2022 . Serial acquisitions and roll-up strategies may also fall within the new merger notification framework, depending on the circumstances and applicable thresholds.
Taken together, financing costs, operating-cost uncertainty and regulatory change provide useful context for the divergence visible in the Indicators data. They should not, however, be read as direct explanations for individual sector movements.
What stands out in the sector data
1. Activity remains concentrated in some sectors
The sectors recording year-on-year growth have different underlying dynamics, but external market data provides some context for their relative strength.
In financial services, PwC has highlighted consolidation and roll-ups across asset and wealth management , alongside transactions aimed at scale, technology and new capabilities.
In property, Australian commercial property transactions increased 16% year on year to $19 billion in the first half of 2026, according to CBRE data reported by Business News Australia. Domestic institutional investors increased their participation as offshore purchasing declined.
And in energy and utilities, PwC has reported continued interest from infrastructure funds, sovereign investors and large strategic buyers , particularly around transition platforms, infrastructure and the data economy.
Data centres and AI infrastructure cut across several of these sectors. PwC has identified data centres, connectivity and software-enabled platforms as a continuing focus for investors , describing them as the foundations of AI. Gilbert + Tobin has flagged data centres as an expected significant source of deal activity in 2026 , supported by hyperscaler investment and government incentives. The Australian Government has also set out its expectations of data centre and AI infrastructure developers , including how they should contribute to the energy transition. Deal Indicators doesn't separate out data centre activity. Because these projects draw on land, power and capital at the same time, though, their influence is likely to show up across property, utilities and technology.
These broader trends are consistent with the stronger activity appearing in several sectors in Deal Indicators, although they should not be interpreted as establishing a direct causal relationship.
2. Transaction timing and preparation remain important variables
Financing conditions and Australia's new merger control regime have added considerations to transaction planning.
For acquisitions that meet the relevant thresholds, notification to the ACCC is now mandatory , and approval or a notification waiver is required before the transaction can proceed.
That does not mean every transaction will take longer. The ACCC has said it expects around 80% of acquisitions to be decided within 15–20 business days through early Phase 1 decisions or notification waivers. But for transactions within scope, regulatory assessment is now another factor that parties may need to incorporate into planning and timelines.
Alongside higher financing costs and continued scrutiny of transaction economics, this may increase the value placed on having information, diligence materials and regulatory considerations addressed earlier in a process.
What the indicators may mean for dealmakers
The August 2026 data does not point to a single ANZ deal market moving at one speed. Instead, it shows meaningful differences between sectors.
For advisors: The Indicators data shows stronger year-on-year activity in financials, real estate, utilities and materials, alongside substantially lower activity in sectors including industrials, health care, energy and consumer staples. These differences provide another data point for understanding where transaction activity is currently appearing and where conditions may be more subdued.
For corporates and business owners: The data suggests transaction conditions currently vary considerably by sector. Information readiness, financing assumptions and potential regulatory requirements are among the factors that may shape transaction preparation and execution in the current environment.
For private equity: Higher financing costs, changing transaction economics and greater regulatory scrutiny form part of the backdrop to current deal activity. In sectors recording lower activity, fewer processes may create a different competitive environment from sectors where transaction activity remains comparatively strong.
These are signals rather than forecasts. Monthly activity can move significantly, particularly in sectors with smaller deal volumes, and the conditions affecting any individual transaction will vary.
Read the signal early
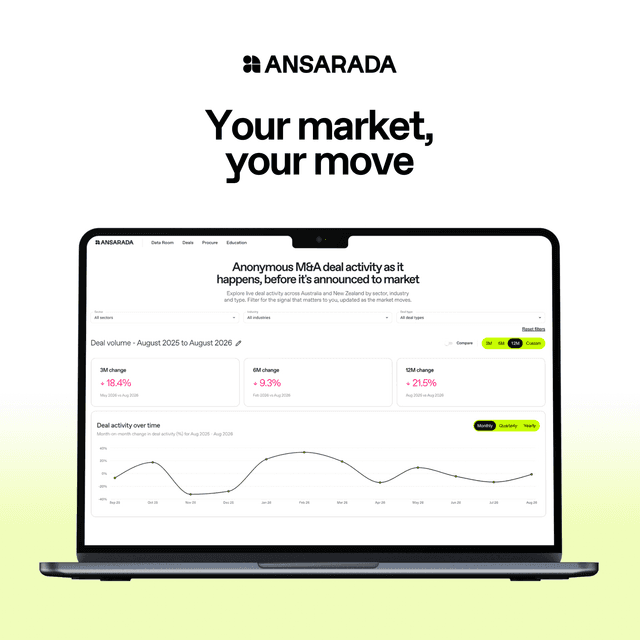
Deal activity can provide an early indication of how transaction conditions are evolving. Ansarada’s Deal Indicators tracks anonymised, aggregated ANZ deal activity in Ansarada data rooms, providing a view of activity before transactions are announced to the market.
Users can filter the data by sector, industry and deal type and compare different periods to explore where activity is increasing, holding steady or declining.
Explore live deal activity across Australia and New Zealand
Filter for the signal that matters to you, updated as the market moves
About the data: Deal Indicators draws on anonymised, aggregated activity in Ansarada data rooms across Australia and New Zealand. The figures in this article compare deal activity in August 2026 with August 2025. Deal Indicators reflects activity observed within Ansarada’s dataset and should not be interpreted as a measure of total ANZ transaction volumes or as a forecast of future deal activity.